Two dice and the long run
Years 5–10Stage 3 to Stage 5Run it
Two dice can land in thirty-six equally likely ways but make only eleven totals. Roll them: how often does each total come up?
Demonstration: a simplified model1 · Thirty-six ways
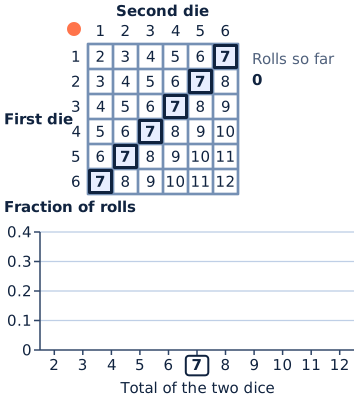
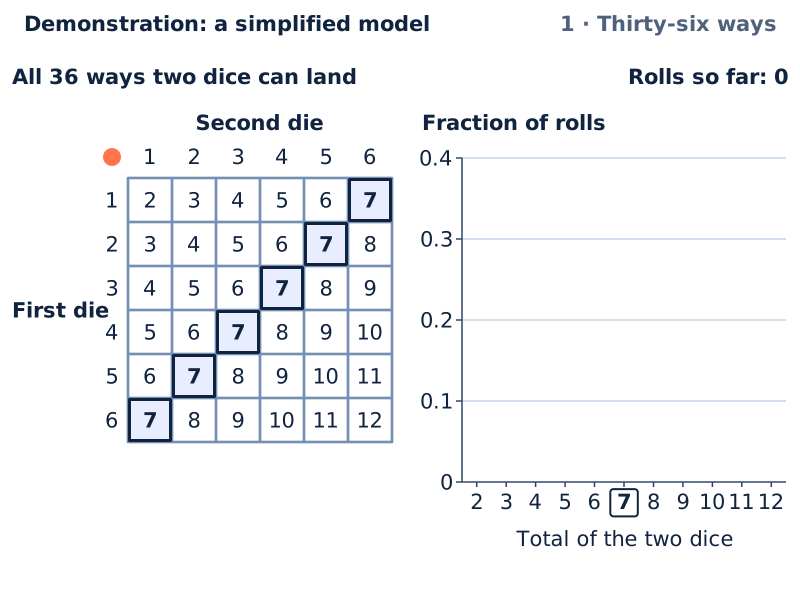
The first die picks the row and the second die the column: 36 cells, each an equally likely way for the dice to land.
Key Heavy outlines: the cells that make the total you follow, and its number under the graph. Columns: the fraction of the rolls so far that gave each total, its relative frequency. The darker column is the total you follow. Dashed: each total's share of the thirty-six cells, the probability the grid gives it. Line: the fraction of rolls that gave the total you follow, after each roll; the dot is the latest.
The model could not start here. The figure, the steps and the table on this page still show the idea; reload the page to try again.
The idea, step by step
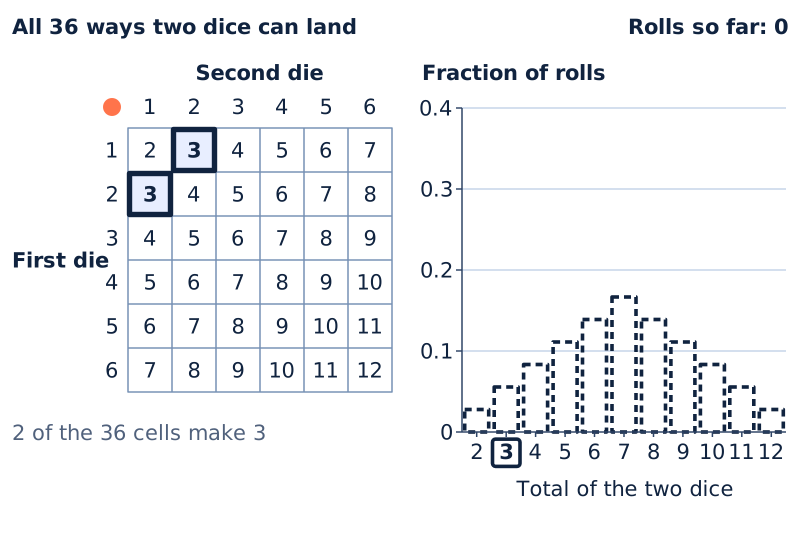
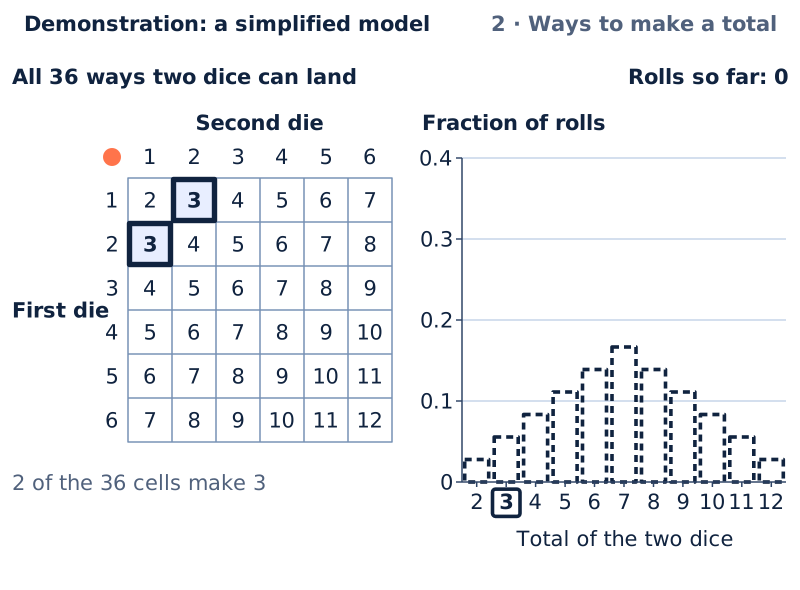
2 · Ways to make a totalOne then two is a different cell from two then one, so three has two ways. The dashed outlines show each total's share. 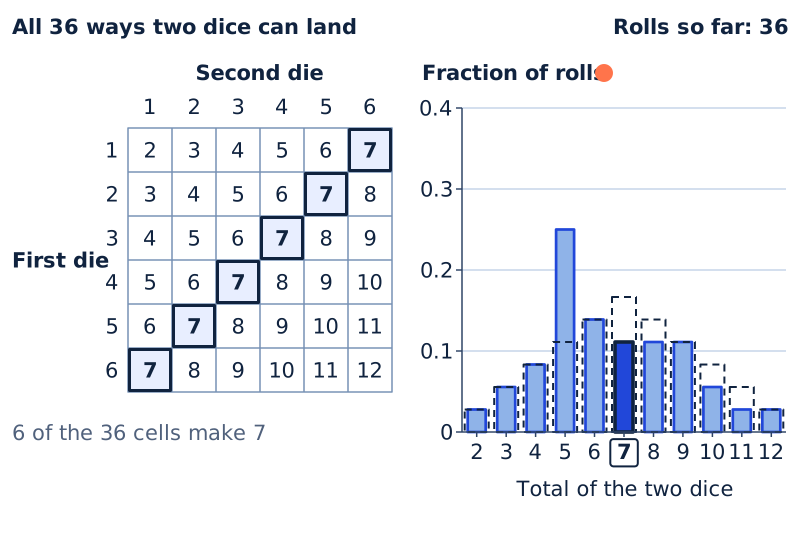
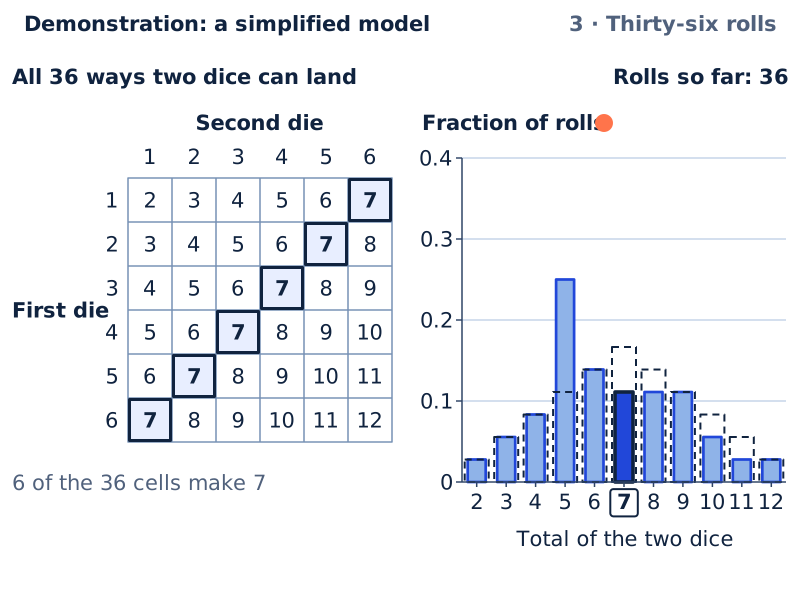
3 · Thirty-six rollsAs many rolls as cells, yet the columns miss the dashed outlines: here five came up more often than seven. 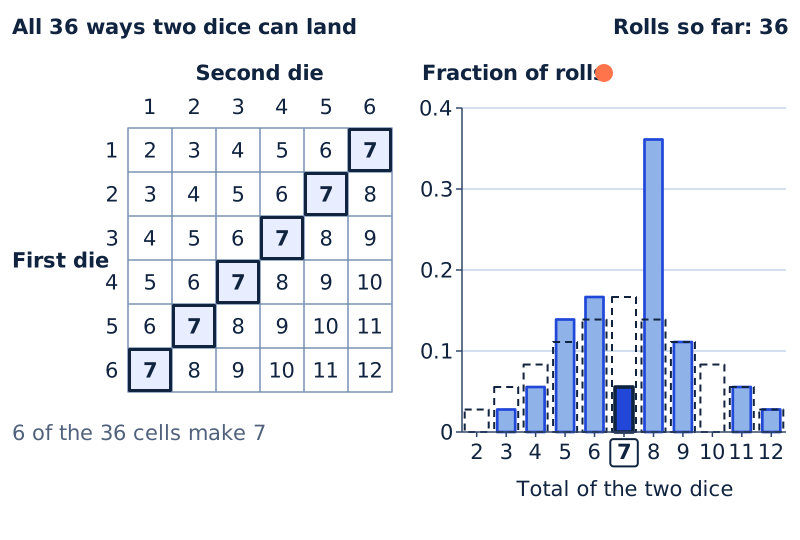
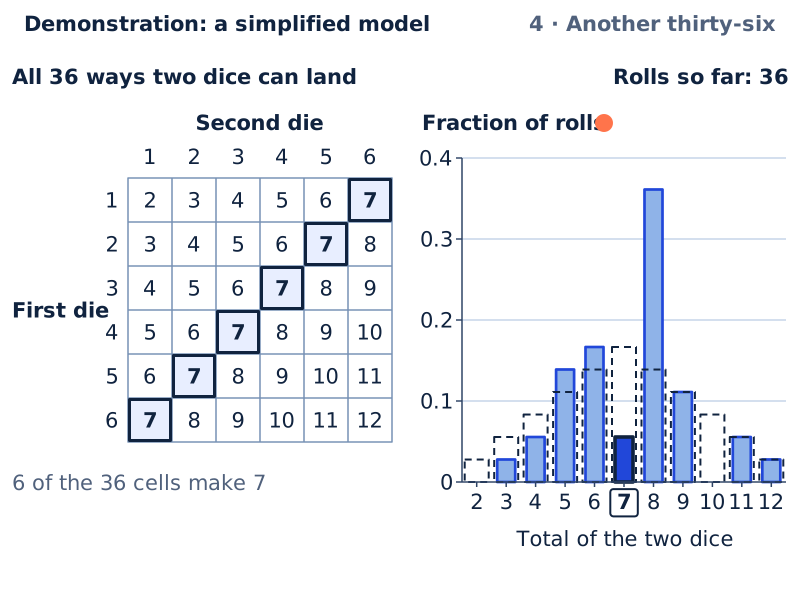
4 · Another thirty-sixA different set of thirty-six rolls gives a different ragged pattern. A small sample wanders; it need not look like the grid. 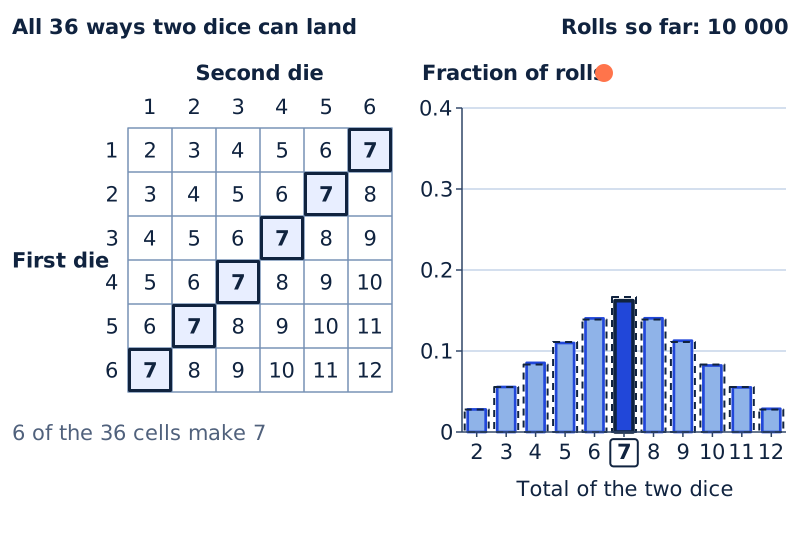
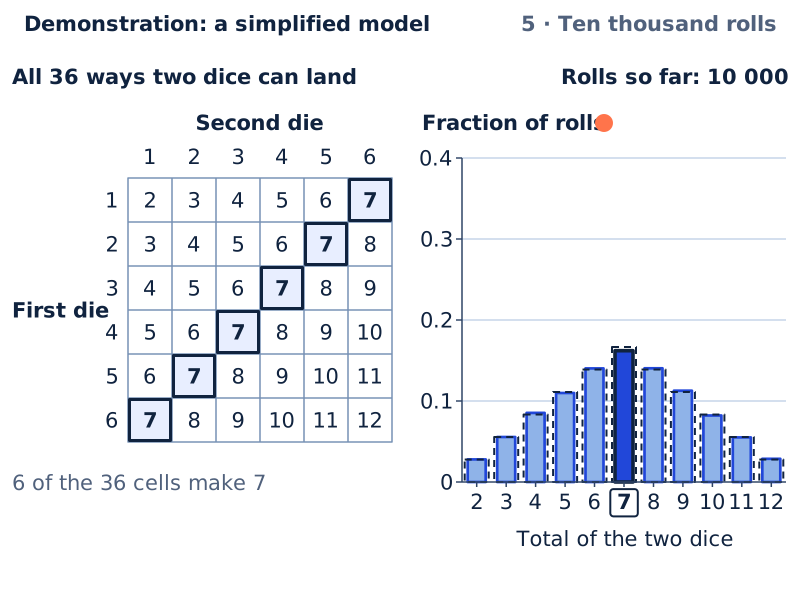
5 · Ten thousand rollsTen thousand rolls: every column sits close to its dashed outline. Sevens are 0.162 of the rolls; the grid gives 0.167. 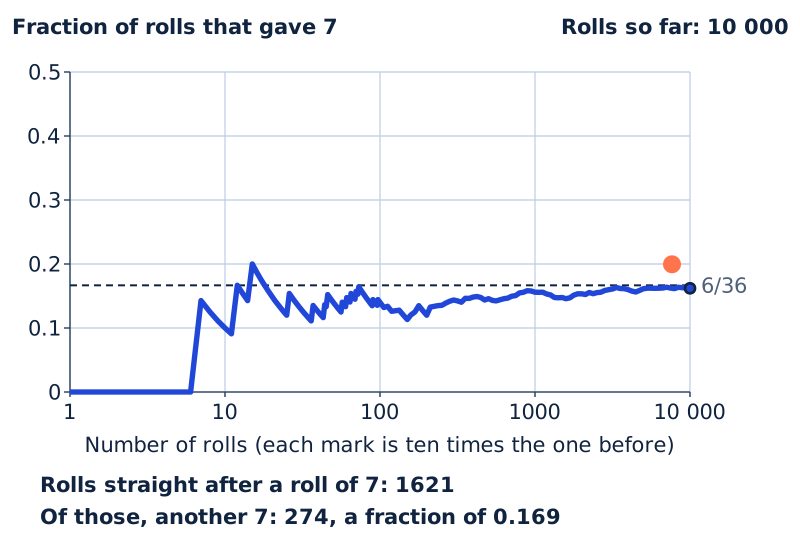
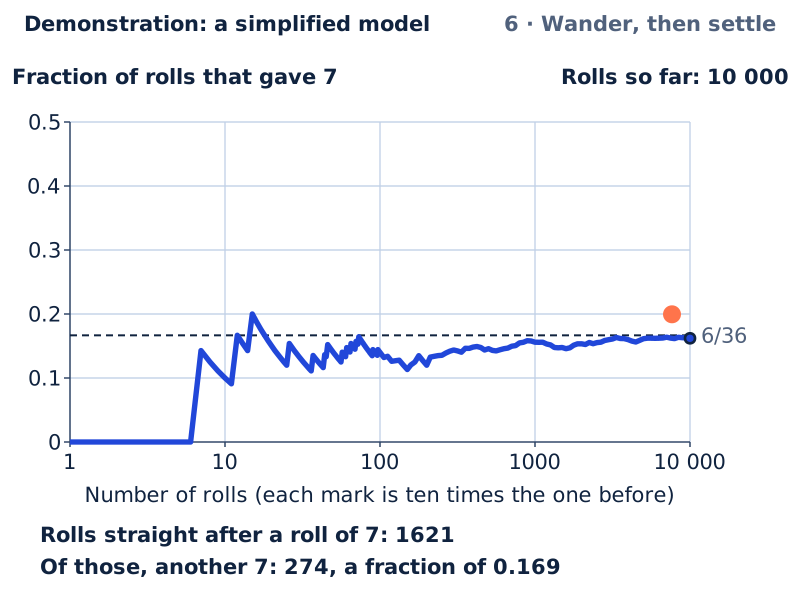
6 · Wander, then settleOver the first rolls the fraction of sevens swings widely. As the rolls add up, it settles close to the dashed line. 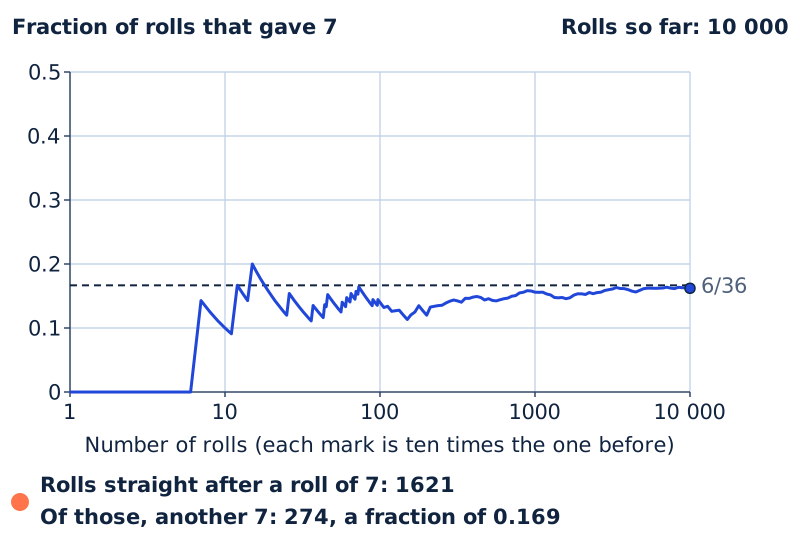
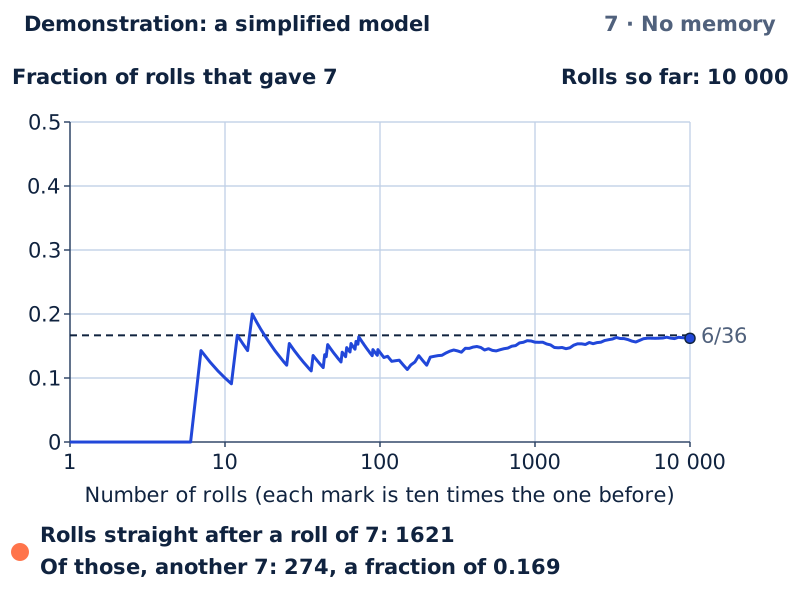
7 · No memoryStraight after a seven, the next roll was a seven 0.169 of the time, close to 0.167: the dice do not remember.


Each total: the cells of the grid that make it, its share of the grid, and the rolls so far that gave it
| Total | Cells that make it | Share of the grid | Rolls that gave it | Fraction of rolls |
|---|---|---|---|---|
| 2 | 1 | 0.028 | 279 | 0.028 |
| 3 | 2 | 0.056 | 555 | 0.056 |
| 4 | 3 | 0.083 | 853 | 0.085 |
| 5 | 4 | 0.111 | 1099 | 0.110 |
| 6 | 5 | 0.139 | 1403 | 0.140 |
| 7 | 6 | 0.167 | 1621 | 0.162 |
| 8 | 5 | 0.139 | 1404 | 0.140 |
| 9 | 4 | 0.111 | 1127 | 0.113 |
| 10 | 3 | 0.083 | 821 | 0.082 |
| 11 | 2 | 0.056 | 551 | 0.055 |
| 12 | 1 | 0.028 | 287 | 0.029 |
Try it in the Lab
Practicals with real materials, each with its safety card.
- Two dice: why 7 comes up mostYears 5–6Hands-on mathematicsLow risk
- Coin toss: more trials, less variationYears 5–6Hands-on mathematicsLow risk
- Rolling one die: relative frequency settles towards one sixthYears 7–8Hands-on mathematicsLow risk
- Sum of two dice: 36 equally likely pairs, 11 unequal totalsYear 9Hands-on mathematicsLow risk
- Fifty coin tosses: real randomness has long runsYear 9Hands-on mathematicsLow risk
Learn it in a lesson
- Assigns probabilities to simple events as fractionsStage 3Find the lesson
- Calculates theoretical probabilities for single-step experimentsStage 4Find the lesson
- Runs experiments and compares relative frequency with theoretical probabilityStage 4Find the lesson
- Designs, runs and evaluates probability simulations using digital toolsStage 5Find the lesson
With a learner
Three questions to ask
- How many cells of the grid make a total of seven, and how many make two?
- After thirty-six rolls, why do the columns not match the dashed outlines?
- You have just rolled a seven. Is another seven less likely next time?
What to expect
Many learners expect every total to be equally likely, or a few dozen rolls to match the grid exactly.
What to try next
Open a practical in Try it in the Lab, above, to roll real dice, tally the totals and compare the class's fractions with the grid.
About this model
What is simplified
- The dice are simulated: each roll picks one of the thirty-six cells, every cell exactly equally likely, and each roll is independent of the ones before. Real dice are very nearly fair, but not perfectly.
- The rolls come from three fixed sets, A, B and C, so every step, test and printed figure shows the same rolls each time. Choose another set to see a different run of rolls.
- Roll the dice makes the first roll straight away, then two a second up to the twelfth, so you can watch each one land: a ring shrinks onto its cell. After that the rolls come faster and faster, up to ten thousand, and the ring is no longer drawn.
- The column graph's scale stops at four tenths. In the first few rolls a column can be taller than that: it is drawn to the top of the scale with an arrow above it, and the table gives its value.
- The Long run graph spreads the rolls out so that each marked number of rolls is ten times the one before. Spread evenly, the first hundred rolls, where the fraction swings most, would be squeezed against the left edge.
Review
Demonstration: a simplified model. Checked against its written sources, 26 September 2026. Not reviewed by a qualified teacher.
Curriculum references
MA3-CHAN-01MA4-PRO-C-01MA5-PRO-C-01MAO-WM-01AC9M5P01AC9M5P02AC9M6P02AC9M7P02AC9M8P02AC9M8P03AC9M9P01
Reference, not a verified alignment.