Heating ice: where does the energy go?
Years 5–8Stage 3 to Stage 4Run it
Everything is made of tiny particles that are always moving. Heating gives the particles energy.
Demonstration: a simplified modelNot to scale1 · Ice
Safety: steam and boiling water scald. Never heat water in a closed container.
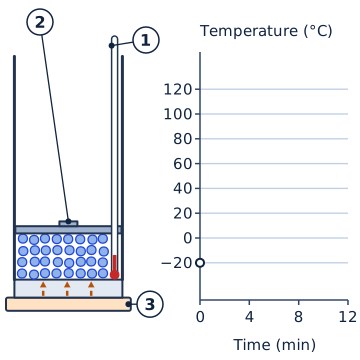
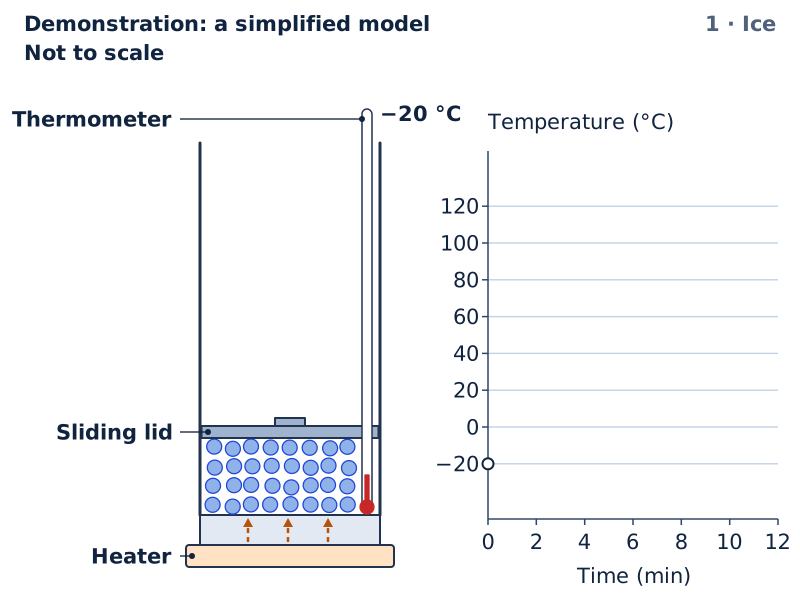
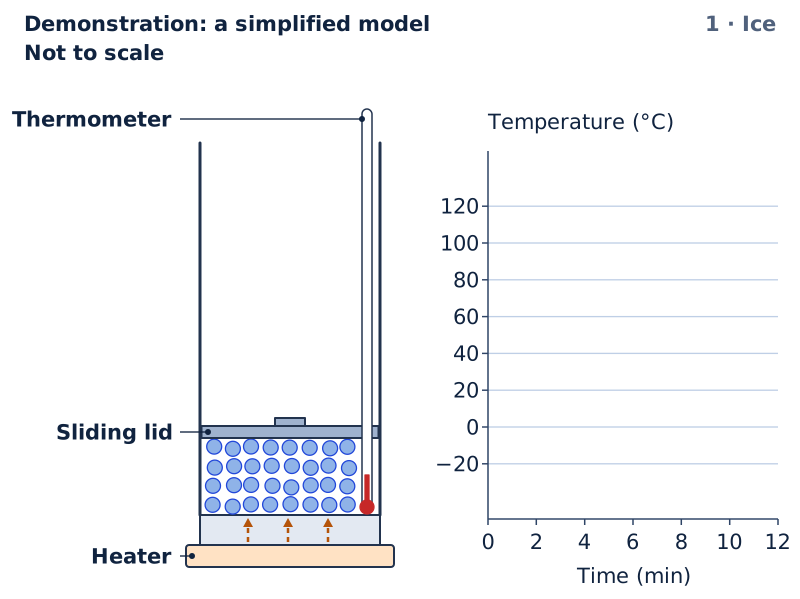
Ice at 20 °C below zero. Its particles sit in fixed places in a regular pattern, each vibrating on the spot.
- Thermometer
- Sliding lid
- Heater
Key Circles: water particles, drawn far larger than real ones. In steam the particles have only empty space around them. Short arrows: the way some particles of steam are moving. Dashed arrows: energy moving from the heater into the water. Dashed arrows: energy moving out of the water into the cooler. Red column: the thermometer's reading. Solid red line: the temperature, as time goes on. Dashed grey line: the same water with the medium setting, to compare.
The model could not start here. The figure, the steps and the table on this page still show the idea; reload the page to try again.
The idea, step by step
Not to scale
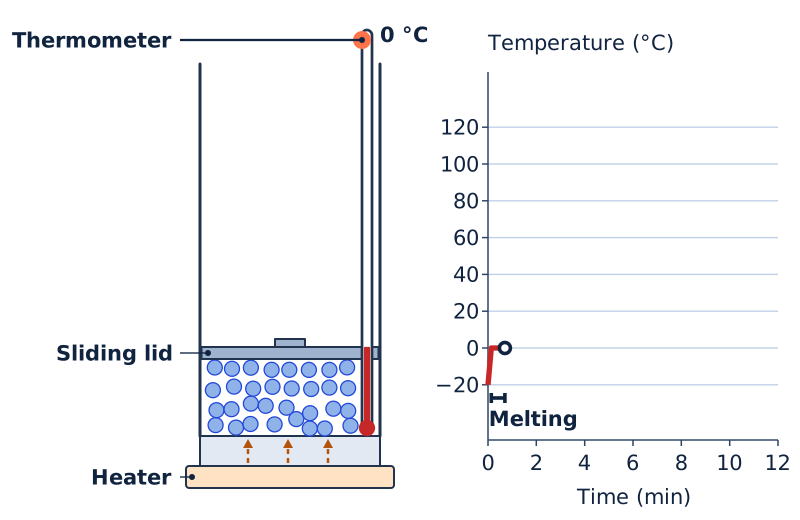
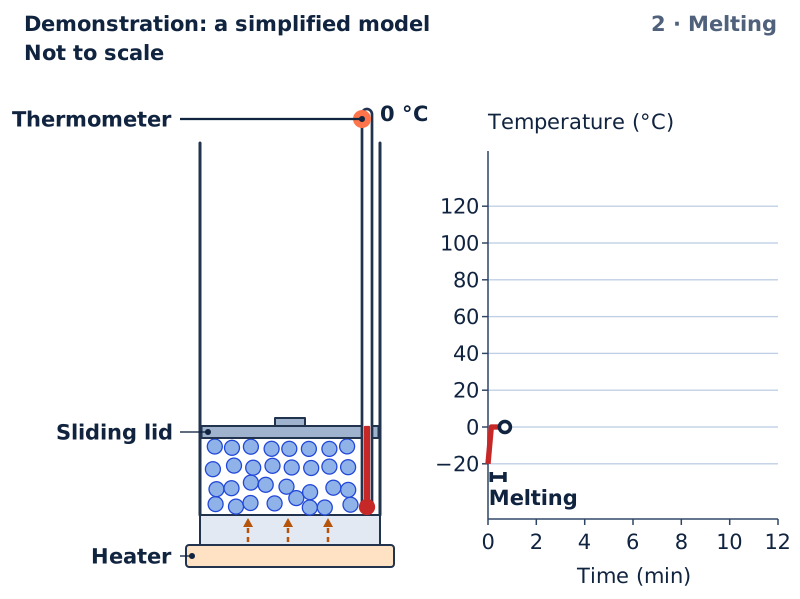
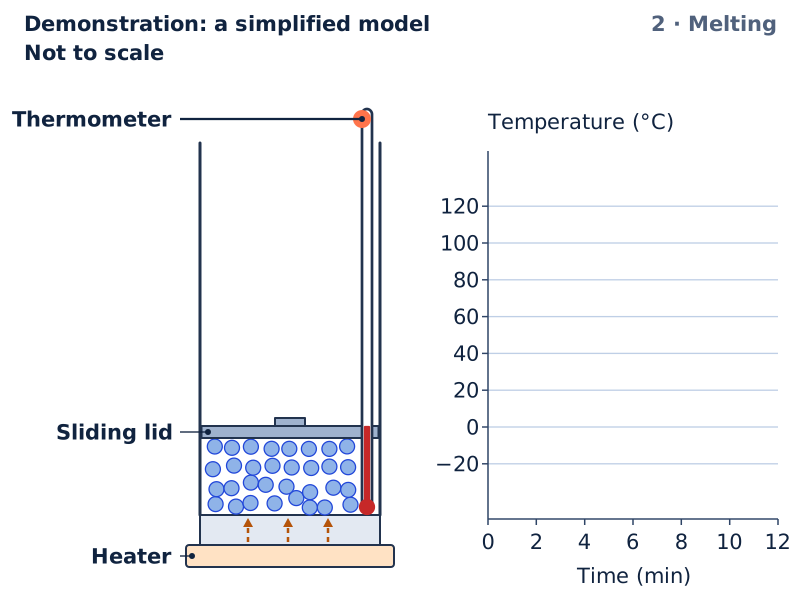
2 · MeltingWhile the ice melts, the thermometer holds at 0 °C, though the heater keeps going. Particles break free of their places; none melts.1 Thermometer · 2 Sliding lid · 3 Heater 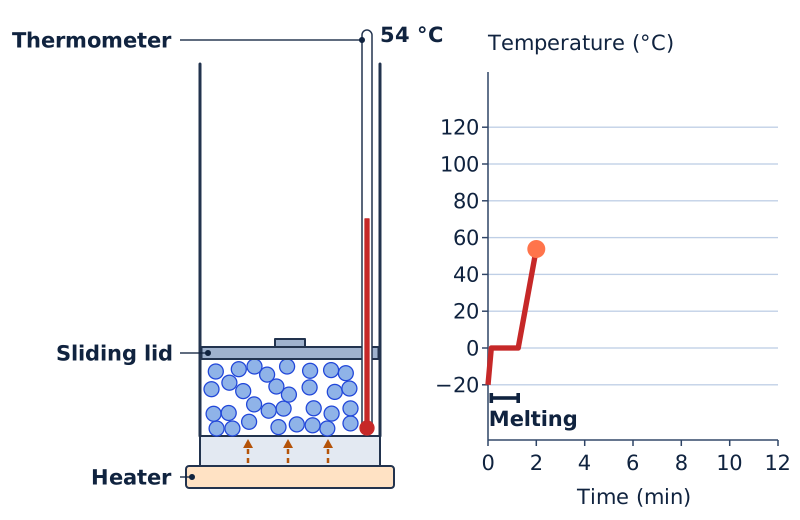
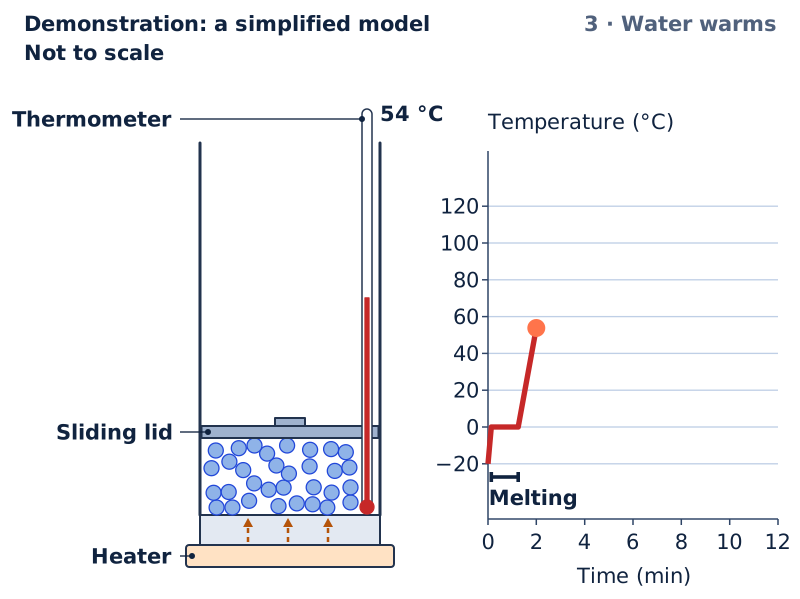
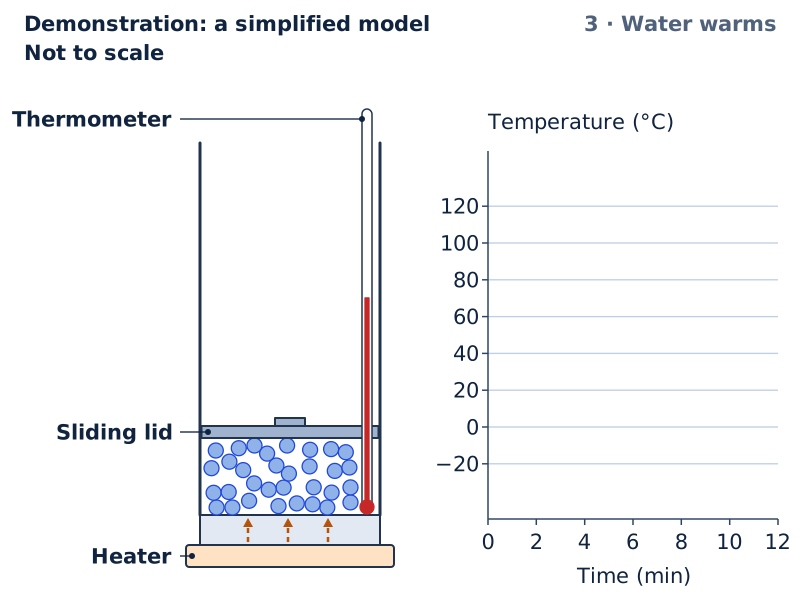
3 · Water warmsAll the ice has melted. The particles touch but slide past each other, and move faster as the water warms.1 Thermometer · 2 Sliding lid · 3 Heater 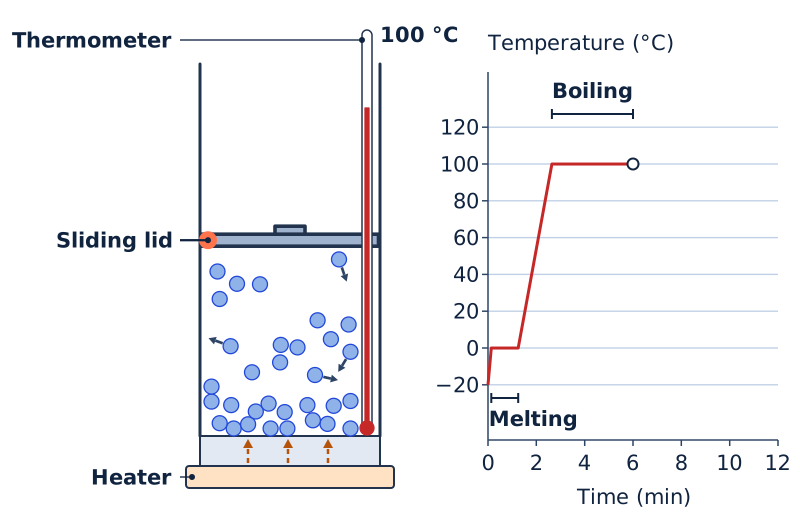
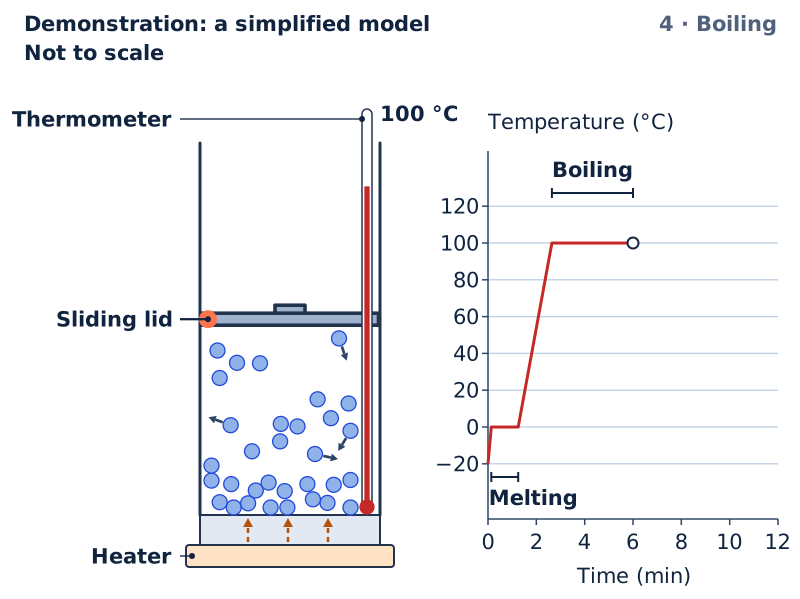
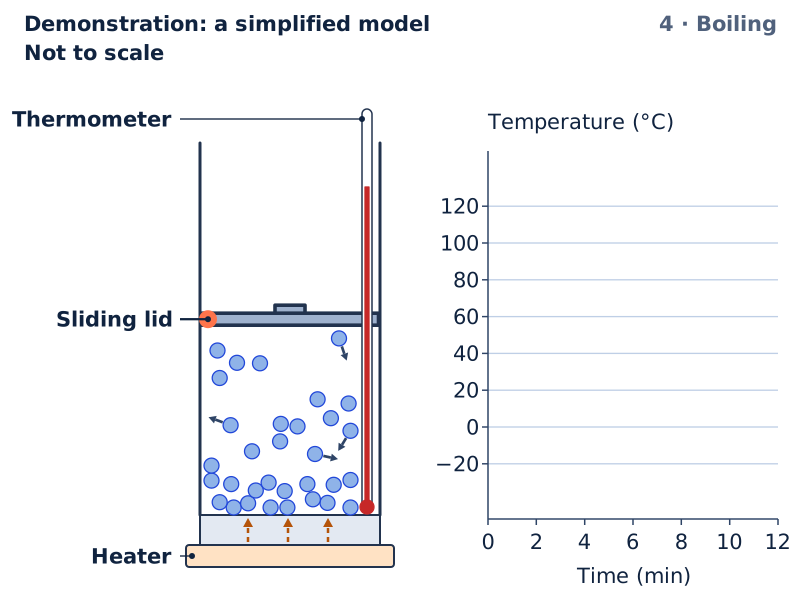
4 · BoilingAt 100 °C the water boils. Its particles leave as steam and move far apart. The space between them holds no air.1 Thermometer · 2 Sliding lid · 3 Heater 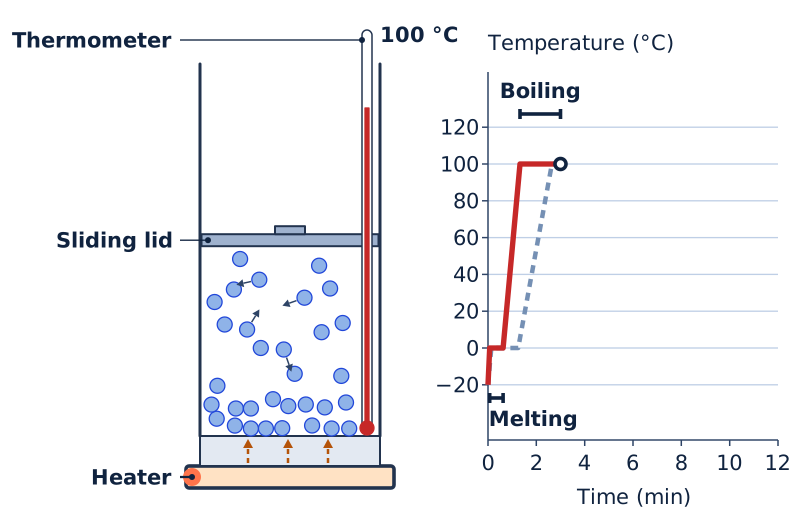
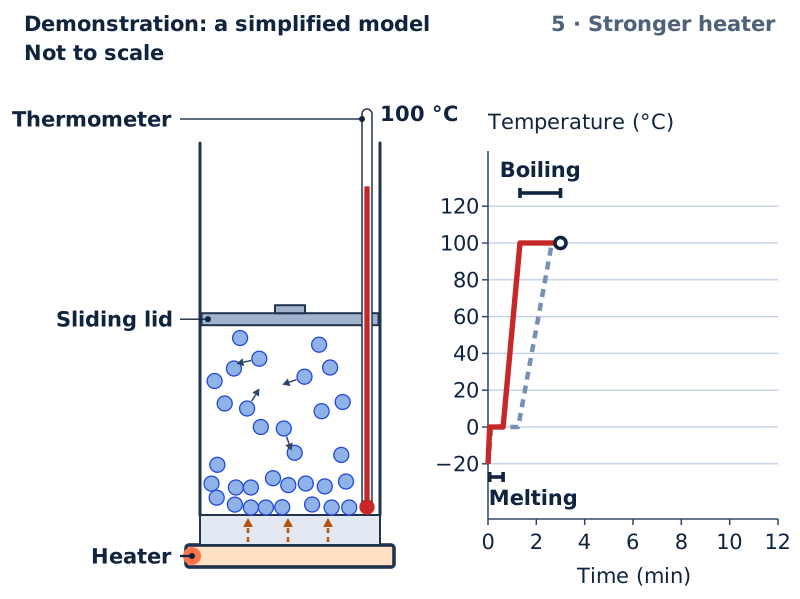
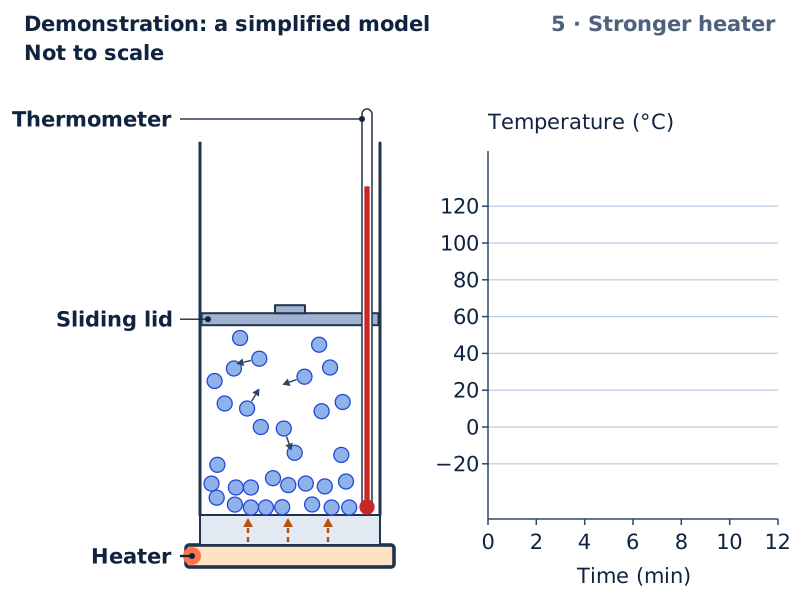
5 · Stronger heaterThe high setting brings the water to the boil sooner and boils it away faster, but it still boils at 100 °C.1 Thermometer · 2 Sliding lid · 3 Heater 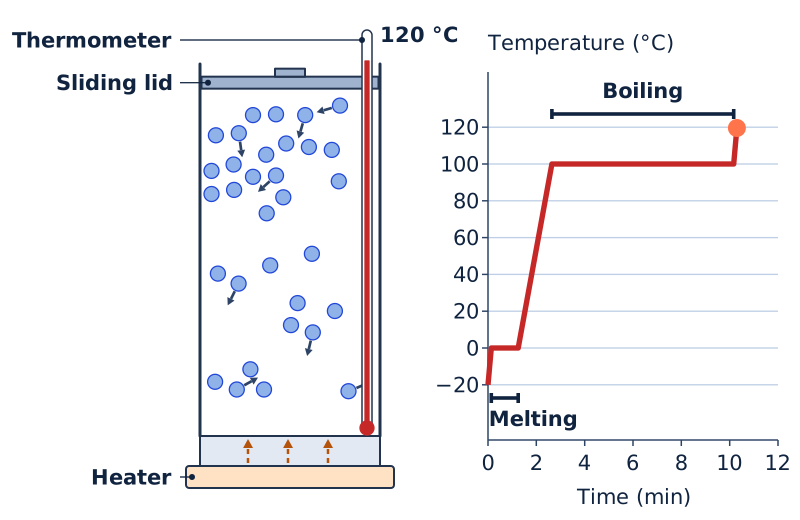
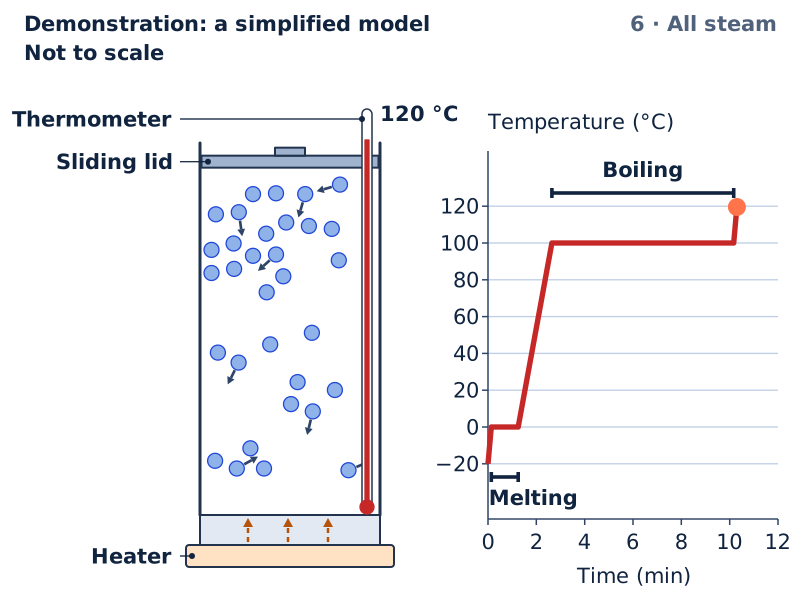
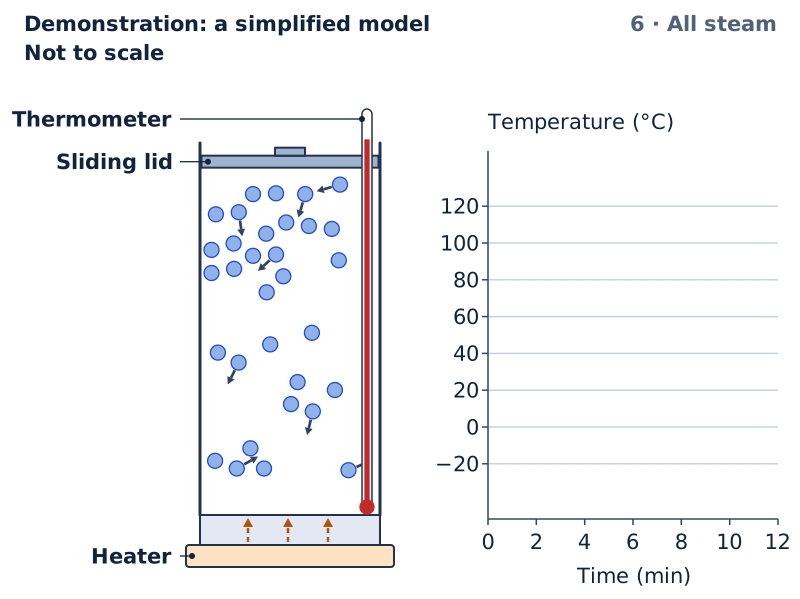
6 · All steamAll steam, at 120 °C. Its particles move faster, so the steam spreads and the lid rises. They stay the same size.1 Thermometer · 2 Sliding lid · 3 Heater 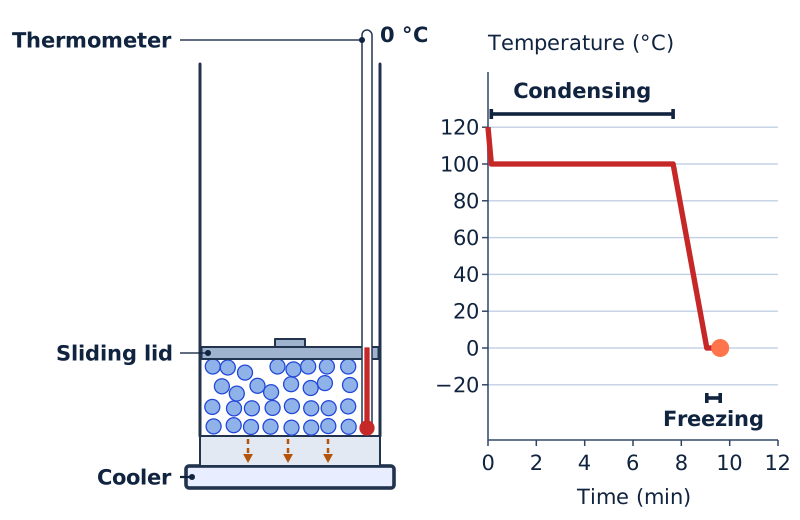
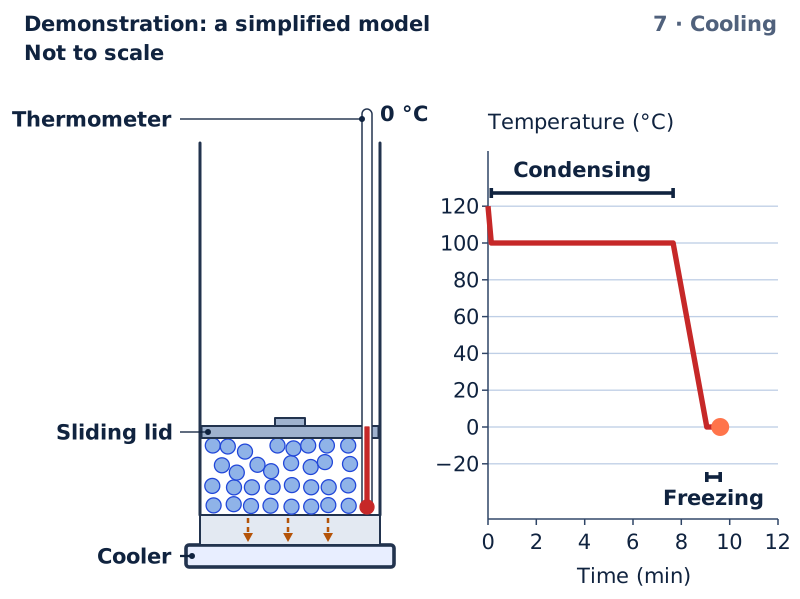
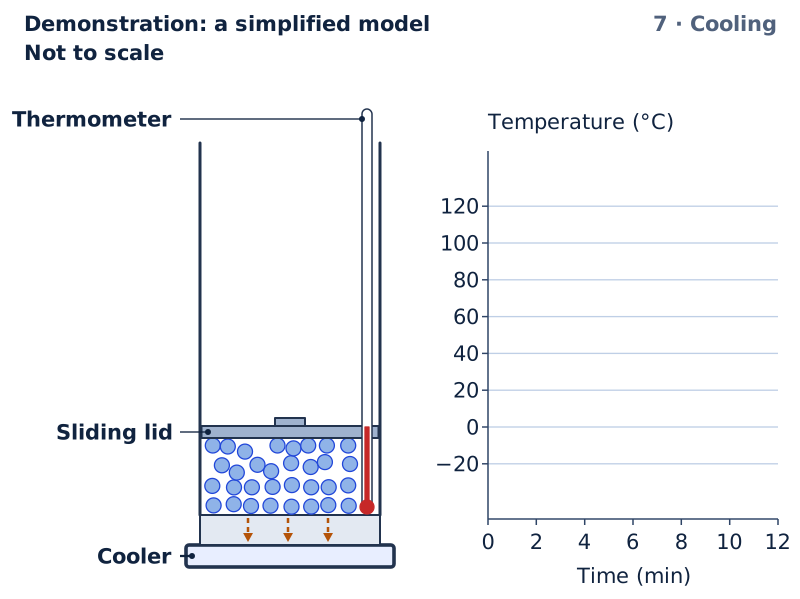
7 · CoolingCooling steam: it condenses at 100 °C and freezes at 0 °C, holding steady each time while energy keeps leaving.1 Thermometer · 2 Sliding lid · 3 Cooler


Each moment a change of state starts or ends, and now
| Moment | Time since the start (min) | Temperature (°C) | State from then on |
|---|---|---|---|
| Start | 0.00 | -20 | Solid (ice) |
| Ice starts to melt | 0.14 | 0 | Melting (ice and water together) |
| The last ice melts | 1.25 | 0 | Liquid (water) |
| Water starts to boil | 2.65 | 100 | Boiling (water and steam together) |
| The last water boils | 10.17 | 100 | Gas (steam) |
| End: all steam | 10.30 | 120 | Gas (steam) |
Try it in the Lab
Practicals with real materials, each with its safety card.
- Melting ice: the thermometer stops at zeroYear 3Bench practicalLow risk
- Cooling curve of stearic acid: temperature holds steady while a liquid freezesYear 7Bench practicalMedium riskSchool laboratory, not for home
- Balloon on a bottle: air expands when it is warmedYear 5Bench practicalLow risk
- Squash the syringe: gases compress, liquids do notYear 5Bench practicalLow risk
- Food dye in hot and cold water: particles move faster when warmYear 5Bench practicalLow risk
- Gas particles move: carbon dioxide diffusing between two test tubesYear 7Bench practicalLow risk
- Brownian motion: smoke particles jostled by air molecules under a microscopeYear 7Bench practicalLow risk
- Latent heat of fusion: ice in water calorimetry and a stearic acid cooling curve (syllabus practical)Year 11Bench practicalMedium riskSchool laboratory, not for home
With a learner
Three questions to ask
- What do the particles in the ice do before it starts to melt?
- Why does the thermometer stop rising while the ice melts, even though the heater is still on?
- Is there anything in the space between the particles of steam?
What to expect
Many learners expect the temperature to keep rising the whole time, and think steam's particles are bigger than water's.
What to try next
Open a practical in Try it in the Lab, above, to melt ice while reading a thermometer every minute, or to watch stearic acid freeze.
About this model
What is simplified
- The model heats 10 g of water in a cylinder whose lid slides freely, so the water stays at normal atmospheric pressure. In a box with a fixed lid, the pressure would rise as the water boiled, and it would boil hotter.
- The particles are drawn far larger and far fewer than real ones, each a circle of one size. Each stands for one water particle, a molecule.
- The solid is drawn as a simple grid. In real ice the particles are held in an open pattern of hexagons, so ice takes up more space than the water it melts into, and floats on it. The drawing gives the solid and the liquid the same space.
- Steam takes up about 1600 times the space of the water it came from. The drawing lets the lid rise only a few times higher, so that it fits.
- The heater and the cooler move energy at a steady rate, and none is lost to the room, so the sloping parts of the graph are straight. The high setting moves energy twice as fast as the medium, and the medium twice as fast as the low. A real tube cooling in air cools quickly at first, then more slowly.
- The particles are drawn speeding up far more than real ones: a real water particle at the model's hottest moves on average only about a quarter faster than one at its coldest. The drawing's speed follows the temperature and nothing else, so it holds steady through both flat parts of the graph, as the real speed does.
- The run is sped up, and each part of it plays for at least a few seconds, so that the short parts can be seen. The time on the graph is the real time.
- In the drawing, ice melts and water freezes from the bottom, next to the plate, and water boils from its surface. In real boiling water, bubbles of steam also form inside the water.
- The time slider stops where the run ends: all steam at the model's hottest, or all ice at its coldest. At the low setting the run stops at the end of the slider, before all the water has boiled.
Numbers and their sources
- 0 °C The temperature at which ice melts, and water freezes, at normal atmospheric pressure. Source: CRC Handbook of Chemistry and Physics, 62nd edition, as tabulated in Wikipedia, Enthalpy of fusion (the row for water), read 26 September 2026.
- 100 °C The boiling point of water at normal atmospheric pressure (sea level), to the nearest degree. The source gives it in kelvin, as the average of several measurements; converted to degrees Celsius it rounds to this value. Source: NIST Chemistry WebBook, SRD 69: Water, phase change data (Tboil), read 26 September 2026.
- 2.05 J/(g·°C) The energy that warms one gram of ice by one degree, measured ten degrees below its melting point, the middle of the range the model warms it through. Source: HyperPhysics, Georgia State University: Table of specific heats (ice), read 26 September 2026.
- 333.55 J/g The energy that melts one gram of ice at its melting point, with no change of temperature. Source: CRC Handbook of Chemistry and Physics, 62nd edition, as tabulated in Wikipedia, Enthalpy of fusion (the row for water), read 26 September 2026.
- 4.19 J/(g·°C) The energy that warms one gram of liquid water by one degree, averaged from its melting point to its boiling point: the source's enthalpies of the liquid at normal atmospheric pressure differ by this much per degree. Source: NIST Chemistry WebBook, SRD 69: thermophysical properties of water, isobaric data at 0.101325 MPa, read 26 September 2026.
- 2256.4 J/g The energy that boils one gram of water at its boiling point, with no change of temperature: the source's enthalpy of the steam less that of the water, both at the boiling point. Source: NIST Chemistry WebBook, SRD 69: thermophysical properties of water, isobaric data at 0.101325 MPa, read 26 September 2026.
- 2.045 J/(g·°C) The energy that warms one gram of steam by one degree at normal atmospheric pressure, averaged over the range the model warms it through, from the source's enthalpies of the steam. Source: NIST Chemistry WebBook, SRD 69: thermophysical properties of water, isobaric data at 0.101325 MPa, read 26 September 2026.
- 1600 How many times more space steam at its boiling point takes than the water it came from: the source's volumes of a kilogram of each, divided, to two figures. Source: NIST Chemistry WebBook, SRD 69: thermophysical properties of water, isobaric data at 0.101325 MPa, read 26 September 2026.
Review
Demonstration: a simplified model. Checked against its written sources, 26 September 2026. Not reviewed by a qualified teacher.
Curriculum references
SC4-SOL-01SC4-WS-06ST3-6MW-SST3-DAT-01AC9S5U04AC9S5I04AC9S7U05AC9S7I05
Reference, not a verified alignment.